After 1 year of activity, our lab is now fully operational. We started by mastering the art of culturing neurospheres starting from human progenitors.
The beautiful picture below shows a collection of our neurospheres after differentiation.
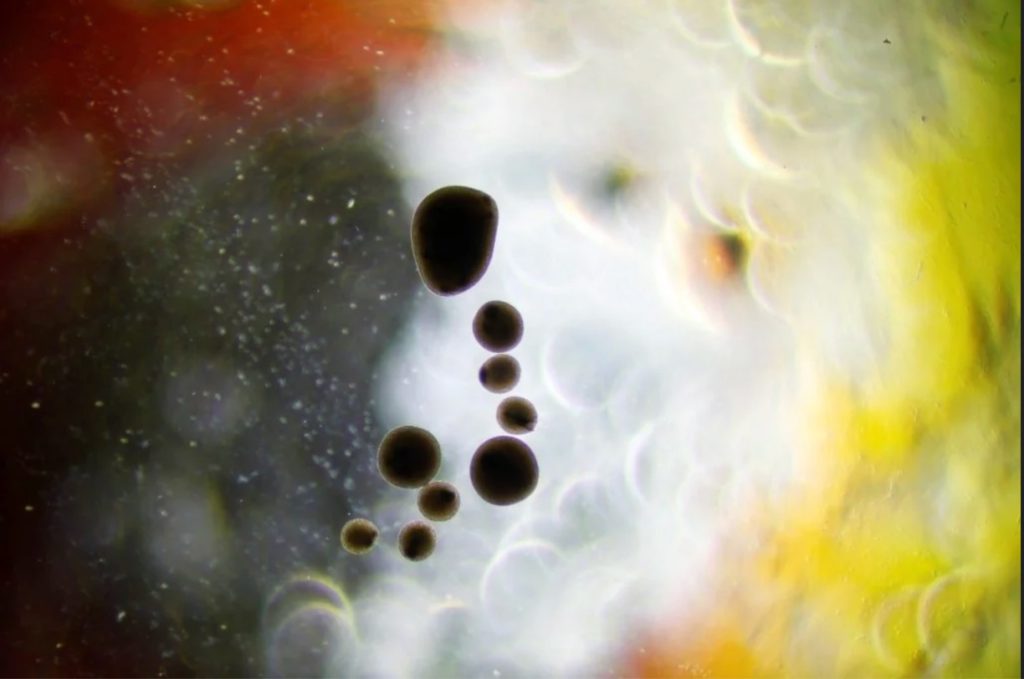
We have now hundreds of them in nursery, sitting orbital shaker. The oldest were made in July 2020 and are still living.
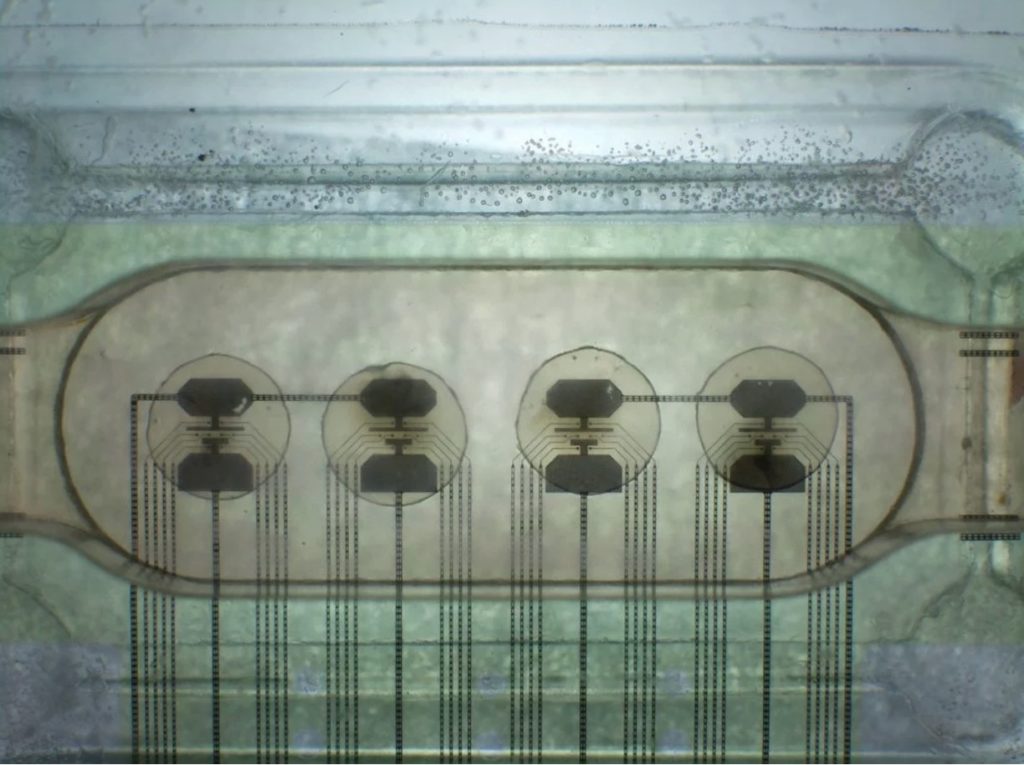
We then acquired the hardware required for electrical activity measurement using discrete electrodes. The picture below shows 4 neurospheres, measured in parallel using 8 electrodes each. Several peristaltic pumps are in use to power a microfluidic system capable of perfusing the medium 24/7. This allowed us to break our record with 5 weeks of constant monitoring of the same neurospheres. We also installed microscopic imaging systems which allows to monitor the microfluidics status. The image below shows a Multi Electrode Array (MEA) from HEPIA with neurospheres in place.
In addition, the spiking activity is recorded 24/7 (but also many other environmental parameters), resulting in gigabytes of data that accumulated over 1 year. The neural activity is constantly broadcasted in live to our public Bioserver.net website, so anyone can check the activity of our neurospheres in real-time.
We then scaled up this system and made 4 of them.
The picture below shows a screenshot of the live webcast for one of the MEAs.
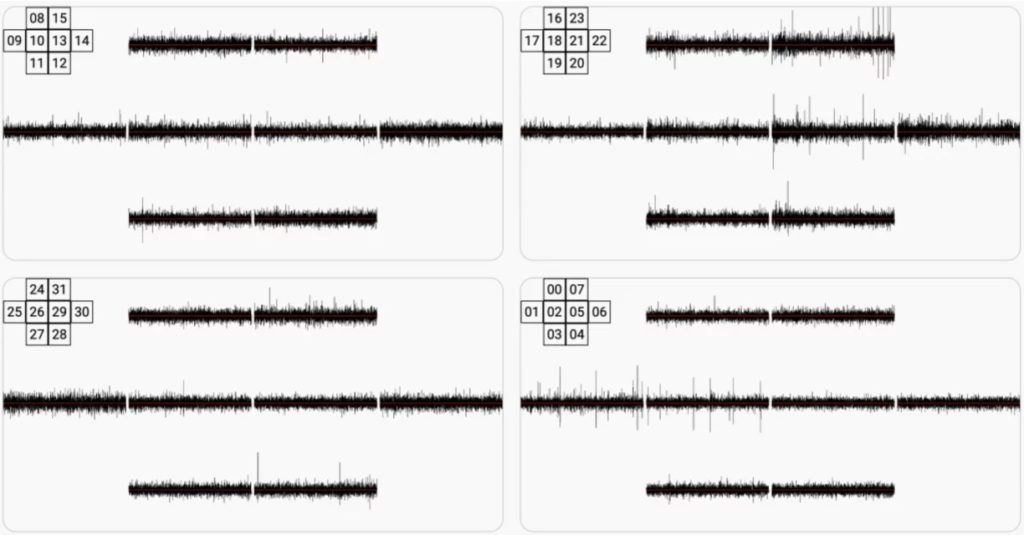
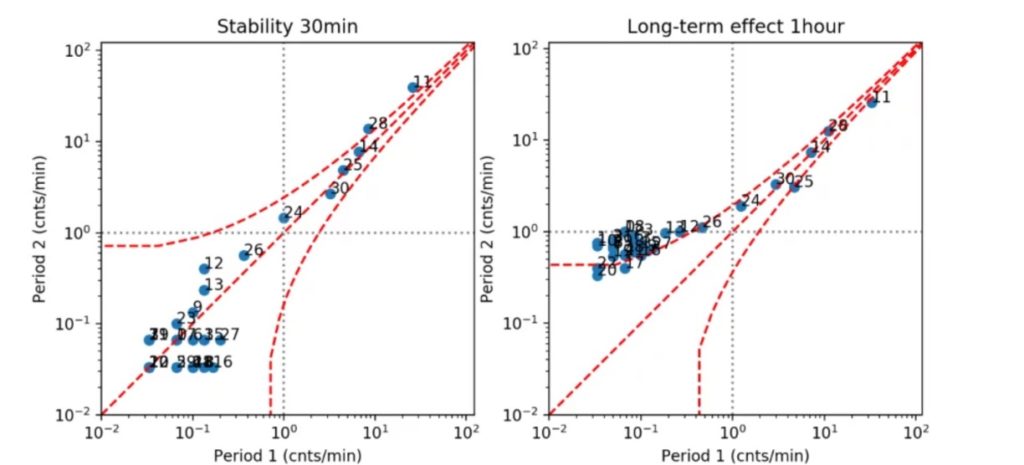
We then started using optimization algorithms approaches in order to manipulate the spiking activity. More precisely, the objective is to induce a Long Term Potentiation (LTP) behavior that we characterize with several metrics, including for instance the firing frequency of spikes. The picture below shows an example of an increased spiking activity after we performed our electrical stimulation paradigm using the Van Pelt diagram approach [1][2].
More precisely, the scatter plots represent average spiking activity recorded on each single electrode on MEA during a time interval of 30 min (on the left) and 1 hour (on the right); x and y axis indicate the mean firing rate [cnts/min]. Dashed lines delineate Poisson distribution of the spike train. If the data points are within the area indicated by the dashed lines, the occurrence of spikes is not statistically significantly different between two time intervals which are compared.
On the left, we can see that average spiking activity does not change significantly when measured at different time intervals, without any external electrical stimulation. On the right, we can see measurements of neuronal spiking activity performed 1 hour after external electrical stimulation (y axis) versus the measurements performed before the external electrical simulation (x axis). Here we can see that the firing rates between these two time intervals are statistically significantly different.
All the results were announced in a press release in September 2020.
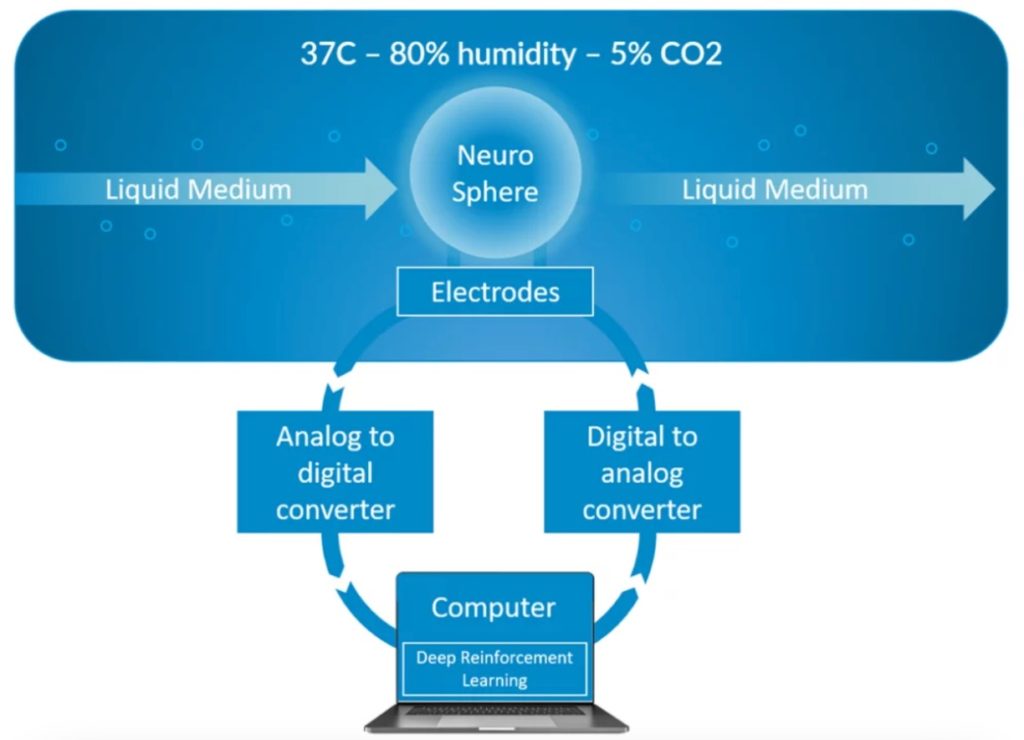
We now have an operational and scaled-up infrastructure in place as depicted in the diagram below. But it is still far from perfect and we are constantly improving it with a special attention to the micro-fluidics since our primary focus is to reach long term viability. The next big challenge is now to make progresses towards an automated training system based on machine learning approaches.